Presidents of Malawi

Every President of Malawi since independence, from Hastings Kamuzu Banda to Peter Mutharika: their terms, parties, vice presidents, and how the national debt changed under each.

Malawi became independent on 6 July 1964 and a republic, with its own president, on 6 July 1966. Seven presidencies, held by six people, have followed.

Vice Presidents of Malawi: everyone who has held the office since 1994. Cabinet of Malawi: the current ministers. Chief Justices of Malawi: the heads of the Judiciary since 1964.

Every president since 1966

  1. 7th President · In office now

    Peter Mutharika

    Democratic Progressive Party · 4 Oct 2025 – present

    Vice Presidents: Jane Ansah; Enoch Chihana, Second Vice President (from October 2025)

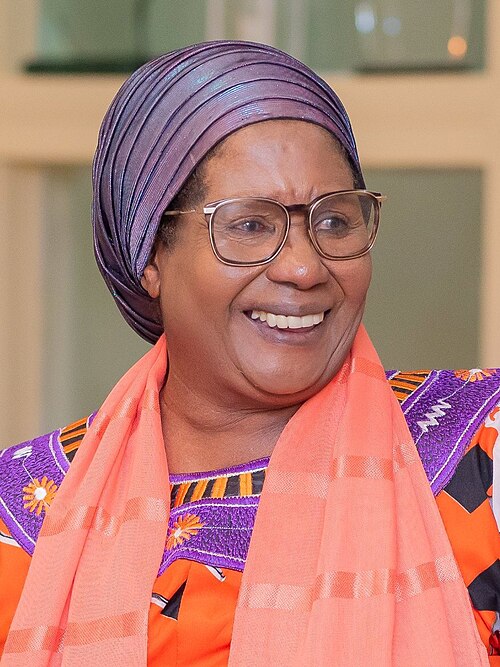
  2. 6th President

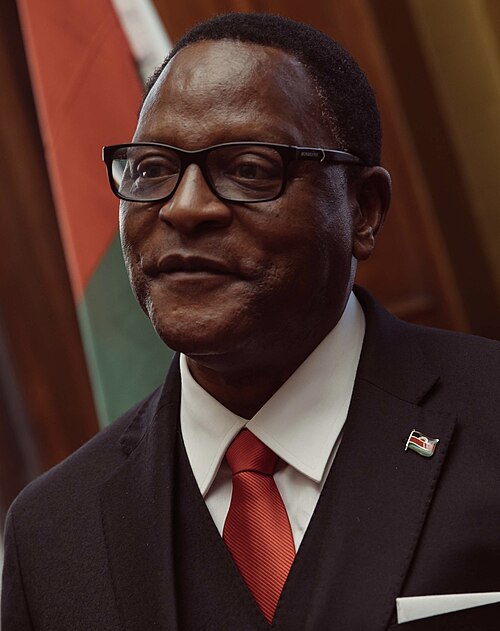
    Lazarus Chakwera

    Malawi Congress Party · 28 Jun 2020 – 4 Oct 2025

    Vice Presidents: Saulos Chilima (2020–2024); Michael Usi (2024–2025)

  3. 5th President

    Peter Mutharika

    Democratic Progressive Party · 31 May 2014 – 28 Jun 2020

    Vice Presidents: Saulos Chilima (2014–2019, and again February–June 2020); Everton Chimulirenji (2019–2020)

  4. 4th President

    Joyce Banda

    People's Party · 7 Apr 2012 – 31 May 2014

    Vice President: Khumbo Kachali

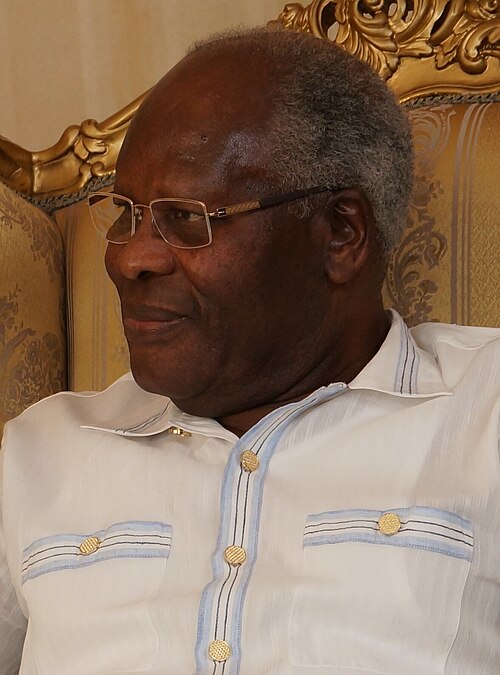
  5. 3rd President

    Bingu wa Mutharika

    Democratic Progressive Party · 24 May 2004 – 5 Apr 2012

    Vice Presidents: Cassim Chilumpha (2004–2009); Joyce Banda (2009–2012)

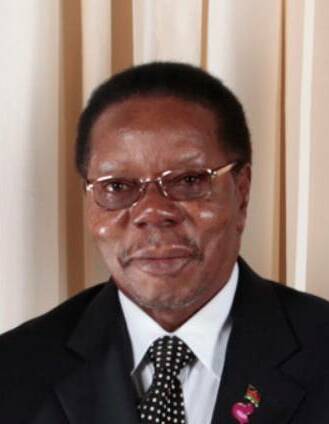
  6. 2nd President

    Bakili Muluzi

    United Democratic Front · 21 May 1994 – 24 May 2004

    Vice Presidents: Justin Malewezi (1994–2004); Chakufwa Chihana, Second Vice President (1994–1996, 2003–2004)

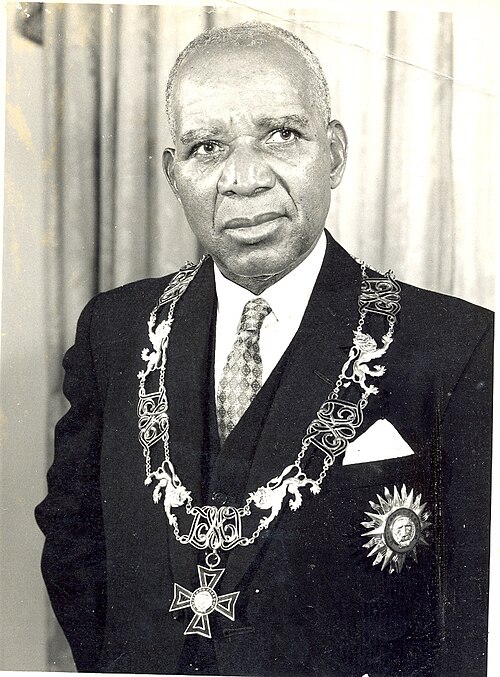
  7. 1st President

    Hastings Kamuzu Banda

    Malawi Congress Party · 6 Jul 1966 – 21 May 1994

National debt by president

How Malawi's public debt changed under every president since independence, measured the same way for all of them: as a share of the economy (GDP), and in US dollars and kwacha.

Updated 10 Oct 2026
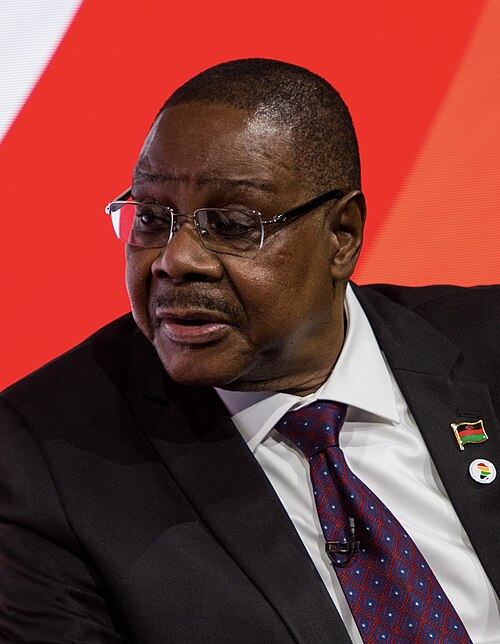
Portrait of Peter Mutharika

7th President · In office now

Peter Mutharika

Democratic Progressive Party · Since 4 October 2025

Debt when taking office: K22.68 trillion, 86.8% of GDP (estimate)

Added since taking office (live estimate)

K1.65 trillion

Growing by about K90,000 every second · 88 days in office

Debt to GDP, end-December 2025
93.2%
Change in debt to GDP so far
+6.4 points
Official total, end-December 2025
K24.33 trillion

Every president

  1. 6Lazarus Chakwera MCP · 2020–2025
    +40 pts
    Debt to GDP
    46.8% → 86.8%
    In US dollars
    US$5.51 billion → US$13.08 billion
    In kwacha (at the time)
    K4.13 trillion → K22.68 trillion
    Measured at
    end-June 2020 → October 2025 (estimate)
  2. 5Peter Mutharika DPP · 2014–2020
    +11.5 pts
    Debt to GDP
    35.3% → 46.8%
    In US dollars
    US$2.83 billion → US$5.51 billion
    In kwacha (at the time)
    K1.03 trillion → K4.13 trillion
    Measured at
    end-2013 → end-June 2020
  3. 4Joyce Banda PP · 2012–2014
    +15.3 pts
    Debt to GDP
    20% → 35.3%
    In US dollars
    US$2.33 billion → US$2.83 billion
    In kwacha (at the time)
    K365 billion → K1.03 trillion
    Measured at
    end-2011 → end-2013
  4. 3Bingu wa Mutharika DPP · 2004–2012 · Died in office
    -64.7 pts
    Debt to GDP
    84.7% → 20%
    In US dollars
    US$3.96 billion → US$2.33 billion
    In kwacha (at the time)
    K385 billion → K365 billion
    Measured at
    end-2003 → end-2011
  5. 2Bakili Muluzi UDF · 1994–2004
    +43.5 pts
    Debt to GDP
    41.2% → 84.7%
    In US dollars
    US$1.24 billion → US$3.96 billion
    In kwacha (at the time)
    K5.5 billion → K385 billion
    Measured at
    end-1993 → end-2003
  6. 1Hastings Kamuzu Banda MCP · 1966–1994
    +23.7 pts
    Debt to GDP
    17.5% → 41.2%
    In US dollars
    n/a → US$1.24 billion
    In kwacha (at the time)
    n/a → K5.5 billion
    Measured at
    end-1970 → end-1993

How this is measured: debt as a share of GDP at the year-end nearest each handover (IMF Global Debt Database, on today's GDP measure), converted to kwacha with World Bank GDP and to dollars at that year's exchange rate. Where the Ministry of Finance published a figure for the handover itself, that figure is used instead: end-June 2020 (Annual Public Debt Report 2019/20) and end-December 2025. October 2025 is an estimate between the Ministry's end-March and end-December 2025 figures. Kwacha amounts from different decades are not comparable because of inflation and devaluation; the share of GDP is. Presidents do not borrow alone: Parliament approves every budget, and droughts, aid flows and world prices shape the numbers. Debt relief under the HIPC initiative in 2006 explains most of the fall under Bingu wa Mutharika. Updated every month.
Back to top